I hate standardized testing.
I've built an entire company around a state exam, and I still hate it. The reductive scoring, the high-stakes gating, the way it flattens a year of mathematical thinking into a single number that determines whether a kid gets a diploma. I hate all of it.
But the three weeks I spend every summer with retake students? Those are my favorite weeks of the year.
The Room on Day One
The students who show up for summer STAAR retake have already failed once. Most of them have failed more than once. They walk in with a posture I recognize immediately—shoulders forward, eyes down, radiating a single message: I'm bad at math and this is going to prove it again.
They are, by every conventional measure, the hardest students to teach.
They're not. They're the easiest.
Here's why: the disillusioned student has no illusions left to manage. They're not performing confidence they don't have. They're not pretending to follow along. They've stopped protecting themselves with "I just didn't study" or "the test was unfair." They've accepted the verdict. And that acceptance, painful as it is, creates an opening that a room full of compliant students never offers.
Their expectations are on the floor. Which means every win hits like a revelation.
"We're Going to Hack This Test"
That's what I tell them. Not "we're going to review linear equations." Not "let's go over the material you missed." I say: we're going to hack this test.
The framing matters. "Review" means more of what already failed. "Hack" means something different—it means us against the test, not you against math. Every decision I make in those three weeks is designed to keep that attitude alive.
The first lesson is slope. Specifically, finding slope using regression on Desmos.
I give them curated problems. They're real STAAR questions—pulled directly from released exams—but I've selected them carefully. Every answer is an integer. Clean numbers. No fractions, no decimals, no ambiguity. When a student types the regression formula into Desmos and reads the slope value, it matches an answer choice exactly. No interpretation needed.
I also give them a step-by-step guide. A physical piece of paper that walks them through every click, every entry. This isn't training wheels they'll outgrow. It's a scaffold—something to look at when they lose their place, something that makes the process survivable while the understanding catches up.
Then I do something that most math teachers would consider irresponsible: I let them answer questions for an hour. And they get them all correct.
Every. Single. One.
What Changes in That Hour
Watch a student who's failed math for three years get ten questions right in a row. Watch their posture change. Watch them stop looking at the clock. Watch them start looking at the screen.
When they miss one—and they do miss some—it's almost never a math error. It's a syntax error. They typed y1~mx1+b instead of y1~m*x1+b, or they entered a coordinate in the wrong column. The scaffold catches these moments. The error isn't you don't understand math. The error is you pressed the wrong key. That distinction matters more than any motivational poster on any classroom wall.
The students aren't learning math in that first hour. Not in the way a curriculum designer would recognize. What they're learning is that the test has structure, the calculator has power, and they can operate both. They're learning that the thing they thought was impossible is actually a series of small, survivable steps.
They're building a control loop—even though they'd never use that phrase. They see a problem, take an action, get clean feedback, and adjust. The perception-action cycle that Perceptual Control Theory describes as the fundamental unit of learning? It's running. For possibly the first time in a math classroom, it's running without friction.
The Progression
After that first hour, I raise the difficulty by exactly one increment.
Fraction answers. Same regression, same process. But now Desmos returns a slope like 0.666... and the answer choices are fractions: ²⁄₃, ³⁄₄, ⁴⁄₅, ½. The student needs one additional step: figure out which fraction equals the decimal. It's the same scaffold, extended by one move. Everything they already trust still works. They're not starting over. They're reaching.
Graph problems. These are harder. The student needs to read two points from a graph before they can use regression. I know exactly where the hiccup will be—they'll invert x and y, reading the vertical axis first because that's how their eyes naturally scan. So I give them a printed table. Two columns: x, y. They extract the points into the table first, then enter them into Desmos. Once the table is filled, they're back to the regression formula they already know.
Each layer adds exactly one new challenge while keeping everything else familiar. The scaffold grows with the student. It never asks them to hold more in their heads than they can manage. It never strips away a support before the next one is in place.
This is the design principle I couldn't articulate when I had a PIP in my file: scaffolding isn't simplification. It's the temporary provision of perceptual support that lets a student operate at a level they can't reach alone. Remove it too early and the loop collapses. Leave it too long and they never internalize the control. The timing has to be right. And the only way to get the timing right is to watch the student, not the pacing guide.
The Numbers
I know the plural of anecdote is not data. So here's data.
The Texas Education Agency publishes summer retake results every year. The numbers are brutal. Across the state, 57 to 66 percent of students who retake the Algebra I STAAR in summer still fail. These are students who already failed during the regular administration. They show up for summer school, get more of the same instruction that didn't work the first time, and the majority walk out without passing.
At Village Tech, where I taught using this approach, the results inverted:
| Year | State Passing Rate | Village Tech Passing Rate | Difference |
|---|---|---|---|
| Summer 2022 | 33% | 67% | +34 points |
| Summer 2023 | 34% | 55% | +21 points |
| Summer 2024 | 44% | 66% | +22 points |
Twenty-plus points above the state average, three years running. Students going from 44% to 80% performance in two hours. Not because they suddenly understood algebra. Because the scaffold let them use the calculator as a reasoning tool, and the curated problems let them succeed long enough to believe they could.
The difference between 33% passing and 67% passing isn't a teaching technique. It's the difference between a student who gets their diploma and one who doesn't.
What the App Does
Those three weeks in summer—the curated problems, the step-by-step guide, the progression from integers to fractions to graphs, the printed tables, the us-versus-the-test energy—that's what MathTabla digitizes.
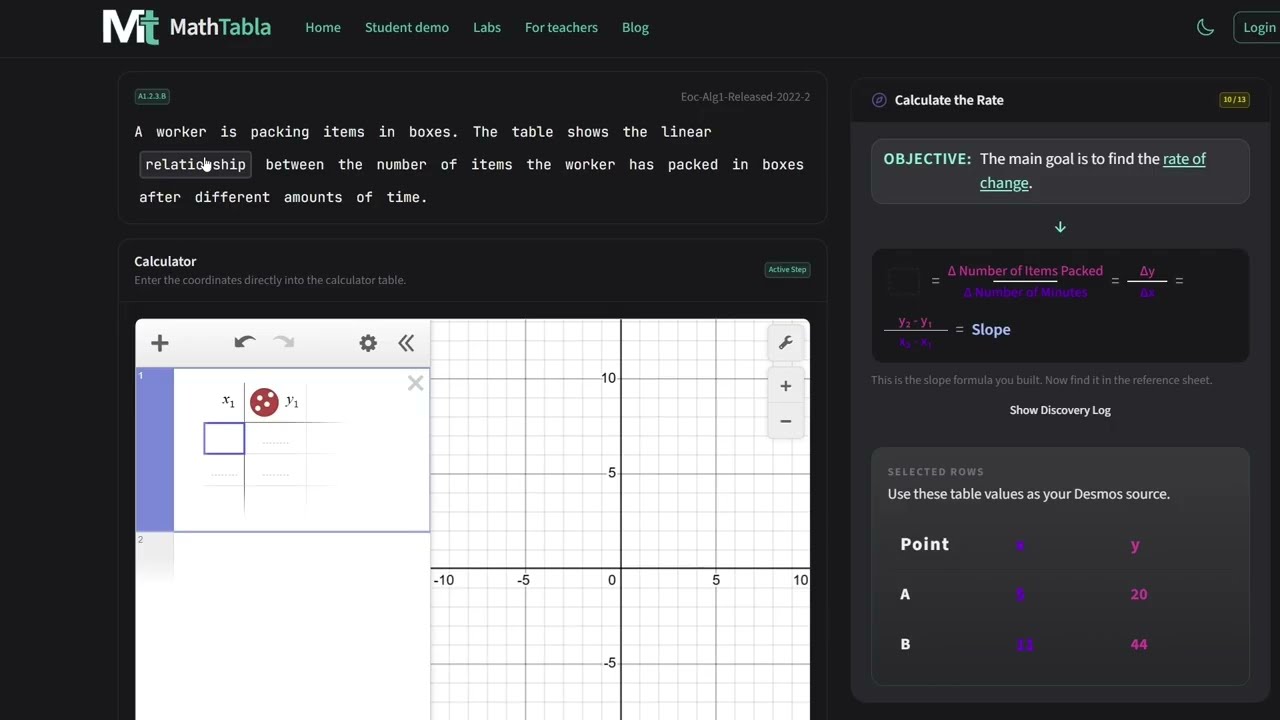
Two-minute walkthrough of the scaffold in motion.
The scaffold system I built takes the approach I developed in the classroom and automates the perception-action loop. Where I used to hand students a printed step-by-step guide, the app provides an operative zone that sits right next to the Desmos calculator, tightening the feedback cycle so the student doesn't have to shuttle their attention across the screen. Where I used to watch for the x-y inversion and hand them a table, the app provides scaffolded coordinate entry with real-time validation. Where I used to curate problems by hand to ensure clean progressions, the AI authoring pipeline generates TEKS-aligned practice items with controlled difficulty.
The animations aren't decorative. Each one is calibrated to the cognitive rhythm of the control loop—showing the student what changed, what it means, and what to do next. The feedback isn't evaluative. It doesn't say "wrong." It shows what happened and redirects attention to the mathematical state. This is Perceptual Control Theory operationalized: clear goal, meaningful action, interpretable feedback, repeat.
You can try it yourself at mathtabla.com/student-demo. Pick a topic and walk through the scaffold. You'll feel the same progression my summer students feel—except the app doesn't need three weeks of my time to deliver it.
The Paradox
I hate standardized testing. I hate that a seventeen-year-old's future narrows based on a single exam. I hate that the system creates the burnout and then punishes kids for being burned out.
But I love those three weeks because they prove something the system doesn't want to hear: the students aren't broken. The instruction is. Give a burned-out kid a calculator, a scaffold, and the framing of "us against the test," and they'll outperform the state average in an afternoon.
The disillusioned student is the easiest to teach—not because they've given up, but because they've stopped pretending. And once you meet them there, once you stop delivering content and start engineering the conditions where their own perception-action loops can run, the results aren't incremental. They're transformational.
That's not a testing strategy. That's what teaching actually is.
MathTabla is building the scaffold system that makes this approach available to every student who needs it—not just the ones lucky enough to land in the right summer classroom. If you're a teacher, a district coordinator, or just someone who thinks burned-out kids deserve better, try the student demo or preview the teacher view.